When it comes to quality capability indicators, the first thing that comes to mind is the process capability index Cp or Cpk and the performance index Pp or Ppk. In the Production Part Approval Process PPAP (Fourth Edition), it is stated that “the initial process capability or performance level must be determined before submitting all special characteristics specified by the customer or supplierâ€, and the stabilization process is given. The ability index Cpk or the performance index Ppk, which slowly evolved into one of the indicators reflecting the process capability of the production line. It is a common phenomenon to use the CPL or the performance index Ppk in the metal cutting production line as an indicator of the quality of the production line. The metal cutting processing line imported from abroad can often achieve a Cpk or Ppk of 2.0 or higher, even if some weak links can reach 1.33, which makes people feel that the quality is very strong.
Relationship between Cpk or Ppk and primary pass rate
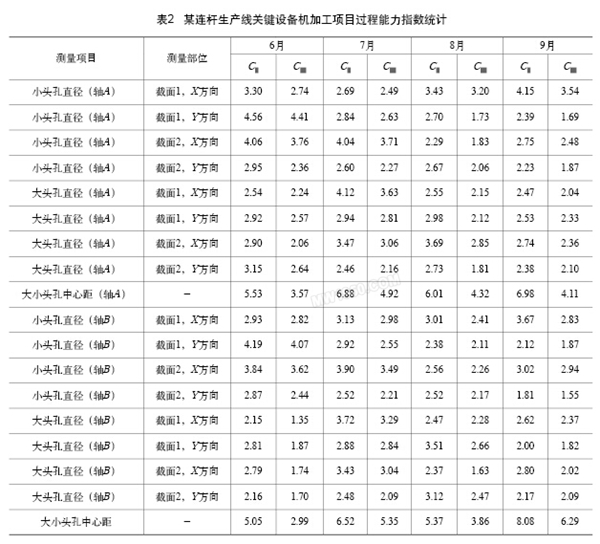
A high Cpk or Ppk does not necessarily guarantee a high first pass rate for the finished product of the production line. The following is a statistics of the Cpk value of a connecting rod production line and the failure rate of the lower line. The connecting rod production line has five machining production equipments, all imported from Germany. The equipment is highly automated and the precision is high. The fifth machine tool processing project contains key dimensions for SPC (Statistical Process Control) control and statistics. Cpk, Table 1 is the statistics of the failure rate of the production line for a period of time. Table 2 shows the process capability statistics of the key equipment of the production line. It can be seen from the two tables that the failure rate of the production line is high, but the process capability index of key equipment is also high.
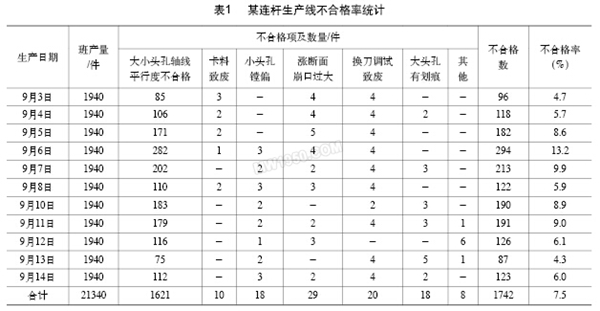
In Table 1, the unsatisfactory parallelism of the axis of the head and the hole, the failure of the tool change and commissioning (the large/small head hole diameter is out of tolerance), and the scratch of the big hole are all caused by the fifth machine tool (key equipment). , accounting for 95.24% of the total number of unqualified items. Since the evaluation index of the production line is set to Cpk≥1.33, although the one-time failure rate is high, because the non-conforming product can be repaired and the high labor-disaster rate index is given, the production line has no improvement on the process. Pressure and power.
Limitations of use of Cpk or Ppk
According to the SPC theory, when Cpk or Ppk is equal to 1, its corresponding failure rate is 0.27%; when Cpk or Ppk is equal to 1.33, its corresponding failure rate is 67ppm (1ppm=10-6); when Cpk or Ppk is equal to 1.67 When the corresponding failure rate is 0.67ppm; when Cpk or Ppk is equal to 2, the corresponding failure rate will be less than 1.0×10⁻⁶. Therefore, many machining production lines use the capability index Cpk or the performance index Ppk, and try to obtain a larger value of Cpk or Ppk, but Tables 1 and 2 have shown that even if a very high Cpk or Ppk is calculated, it is very practical in production. It is difficult to achieve a theoretically low rate of failure, because these two indicators have limitations in use, mainly the following:
1) A large amount of measurement work is required, and the labor intensity of the personnel is large. Some parameters are difficult to measure or measure very uneconomical or destructive tests and cannot be measured in large quantities. These items that cannot measure data to calculate Cpk or Ppk are likely to be unqualified due to other defects.
2) When sampling, samples must be taken from the production parts that have been stably produced for a period of time. The first part of the boot, the first part of the tool change, the processed part of the cold state, and the first piece after the equipment is repaired and debugged are basically excluded from the sampling range. In fact, this unstable processing time exists in every shift of production process, and it is also a high-risk period that is prone to produce non-conforming products.
3) When calculating the ability index Cpk or the performance index Ppk, it is allowed to eliminate some "bad" data, which makes the calculation result become "good-looking", giving the illusion that the process is stable and powerful.
One pass rate DR and one pass loss rate DRL
It is more practical to use the primary pass rate DR and the one pass loss rate DRL as the production line quality capability index. The primary pass rate DR is the ratio (DIRECT RUN) of the product that can flow into the next process without rework or rework during the manufacturing process. According to the definition of DR, DR ≤ 1 and is a positive number. The purpose and significance of counting and controlling the pass rate DR is to analyze and improve the factors that affect the output efficiency of the product manufacturing process, and improve the output efficiency from the surface.
Assuming that the production line has five production processes A, B, C, D, E or five measurement points, the total pass rate of the entire production line is:
DR= DRA×DRB×DRC×DRD×DRE
The one-time loss rate DRL refers to the ratio of the number of defects found in the manufacturing process to the production (DIRECT RUN LOSS). According to the definition of DRL, DRL ≥ 0. The purpose and significance of counting and controlling the one-time loss rate DRL is to reduce the rework/rework ratio and the cost of repair.
Assuming that the production line has five production processes A, B, C, D, E or five measurement points, the total one-pass loss rate of the entire production line is:
DRL= DRLA+DRLB+DRLC+DRLD+DRLE
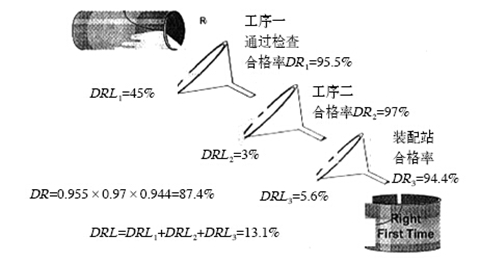
Figure 1 Example of DR and DRL
According to the definitions of DR and DRL mentioned above, the failure of the whole production line or the defects of the product caused by any process or link will cause the first pass rate of the entire production line to decrease and the loss rate of the first pass to rise, scientifically and rationally stipulate DR and The DRL indicator will prompt all relevant personnel in the entire production line to act to find out the factors affecting the quality of the product and improve them, avoiding the illusion that the unique data acquisition and processing methods of Cpk or Ppk are given to the production line process, and DR and DRL can expose the implied quality cost, and can fully control the production process. It is a scientific indicator that can correctly characterize the quality of the production line. Figure 1 is an example of this indicator.
DR and DRL application examples
The assembly line of an engine factory is determined by DR/DRL as the process quality capability monitoring index. The DR/DRL statistical scheme is six points: camshaft rotation torque detection; crankshaft axial clearance detection; crankshaft rotation torque detection; waterway seal detection; cold test Bench inspection; hot test bench inspection. At the same time, the DR/DRL index is determined: point 1~4 requires DR99%, DRL≦1%; points 5 and 6 require DR98%, DRL2%, so the whole production line requires DR92%, DRL8%. Monitoring data requirements are counted by day and reported weekly. Figure 2 is a weekly graph of an engine assembly line DR/DRL.
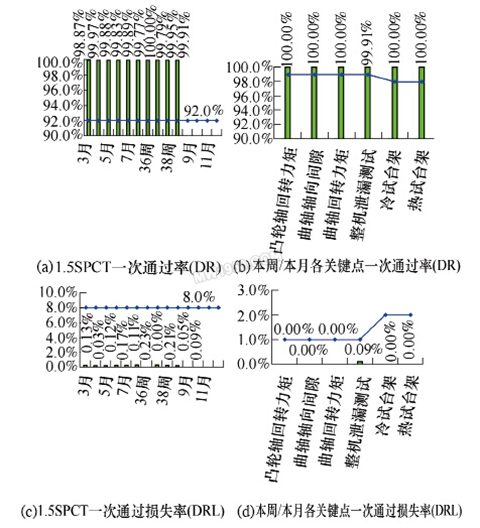
Figure 2 Engine statistics
Conclusion
Pairing using one-time pass rate DR and one-time loss rate DRL can quickly and accurately find the quality abnormality of the entire production line. As a quality indicator of production line, it is not possible to count only “good data†and “bad data†in statistical calculation. So that the entire production line personnel take strict control measures on all factors affecting the quality of the product, such as people, machinery, materials, law, ring, measurement, storage and transshipment, and at the same time spur people to take the initiative in the process of variation factors Take improvement measures. These two indicators, as indicators of production line quality capability, have practical significance for improving product quality and reducing costs.
Common 5:1 Two-Component Binder-Red
5:1 Polyurethane Binder,Common 5:1 Polyurethane Binder,Common 5:1 Two-Component Binder,Common 5:1 Two-Component Binder Part B
Zibo Century Union New Building Materials Co.,Ltd , https://www.cum-sports.com